Source apportionment advances using polar plots of bivariate correlation and regression statistics
Source apportionment advances using polar plots of bivariate correlation and regression statistics
Abstract
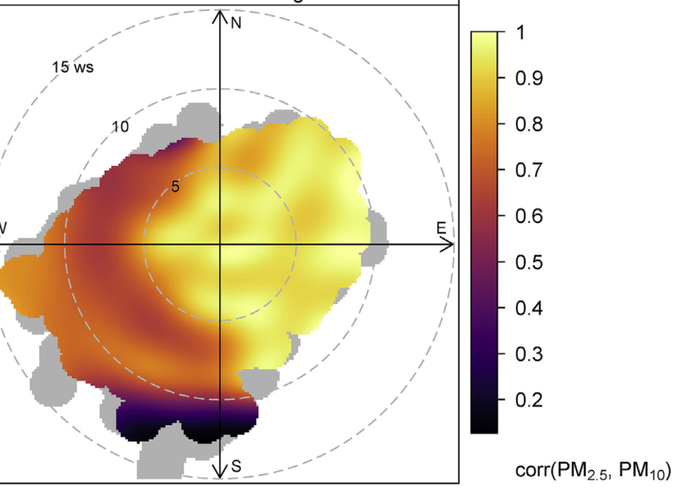
This paper outlines the development of enhanced bivariate polar plots that allow the concentrations of two pollutants to be compared using pair-wise statistics for exploring the sources of atmospheric pollutants. The new method combines bivariate polar plots, which provide source characteristic information, with pair-wise statistics that provide information on how two pollutants are related to one another. The pair-wise statistics implemented include weighted Pearson correlation and slope from two linear regression methods. The development uses a Gaussian kernel to locally weight the statistical calculations on a wind speed-direction surface together with variable-scaling. Example applications of the enhanced polar plots are presented by using routine air quality data for two monitoring sites in London, United Kingdom for a single year (2013). The London examples demonstrate that the combination of bivariate polar plots, correlation, and regression techniques can offer considerable insight into air pollution source characteristics, which would be missed if only scatter plots and mean polar plots were used for analysis. Specifically, using correlation and slopes as pair-wise statistics, long-range transport processes were isolated and black carbon (BC) contributions to PM$_{2.5}$ for a kerbside monitoring location were quantified. Wider applications and future advancements are also discussed.