Abstract
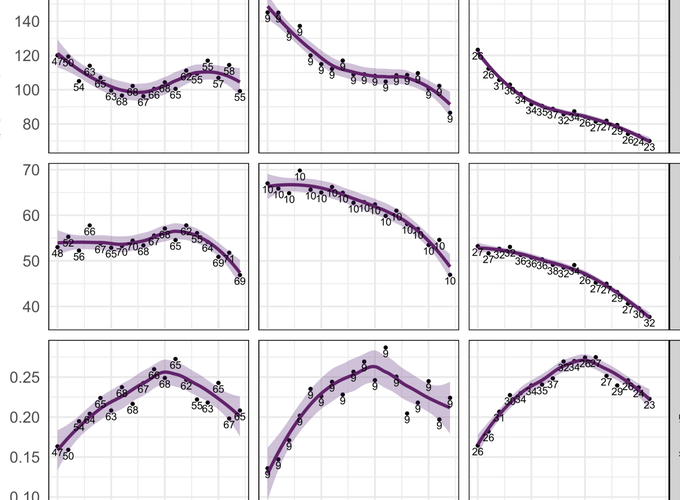
Trend analysis of air pollutant concentrations becomes problematic when applied to data from air quality monitoring networks containing time series of differing lengths. The average trend from such data can be misleading due to biases in the monitoring network. For example, if new monitoring sites located in more polluted locations are added to a network, the introduction of these time series can leverage the trend upwards. A method for resolving this problem was developed, using rolling window regression to recursively calculate the change in pollutant concentration as a function of time, which can be used as a proxy for the true trend. The efficacy of the method was established by conducting simulations with known trends. The rolling change trend was shown to more accurately reflect the true trend than simply averaging the time series. Application of the technique to estimate trends in NO$_x$, NO$_2$ and NO$_2$/NO$_x$ concentrations at London roadside monitoring sites over the period 2000–2017 revealed clear differences from the simple average. In particular, a significant monotonic downward trend in NO$_x$ concentration was observed, in stark contrast to the average trend, which suggested little change in NO$_x$ concentration had occurred over the same period. By accurately representing trends using time series of different lengths, this method has the benefit of being able to describe changes in air quality for locations and time periods with otherwise insufficient data.
